- DemoDivMS
DemoDivMS
Authors and description
- N. Nikolic(contact author), INRA
- C. Chevalet , INRA
This program DemoDivMS is designed to predict the genetic diversity at a microsatellite DNA marker, in a finite population, for various mutation models and for variable population size.
The program is very quick. It is written in Fortran and makes use of NAG numerical routines. It creates small files of the order of 50Ko.
Download
Important : the NAG library is needed in order to use the software DemoDivMS.
Download source code (version 0.2) demodivms-0.2.0.tar.gz You can them easily compile and run it under linux/unix OS.
Description of the model
The goal of the program is to propose a tool able to describe the expected current genetic diversity at a microsatellite marker from the past history of a population.
The user describes the mutation process of the marker and the demographic history of the population; the program estimates the final genetic diversity using coalescent theory adapted to variable effective size. For any pair of alleles sampled in the population, the program provides the probabilities P0, P1, P2, … Pd,… that alleles of the pair show a difference D of 0, 1, 2, … d … repeats of the microsatellite motif. Associated measures of diversity are given: the mean and variance of the |D| values, and the values of theta (the parameter 4 N µ) derived from expected heterozygosity or from the distribution of D .
h3.Mutation process
The microsatellite marker is assumed to be submitted to a symmetrical Stepwise Mutation Model, so that the number of motifs is increased or decreased by a number k with equal probabilities if some mutation occurs. Available options include the single step mutation model, the geometric model (the probability that mutation leads to k steps is (1-c) c(k-1) for some c<1, or any user-defined model (mutation leads to k steps with probability mk).
h3.Past demography
The demographic history is given as a chain of J intervals of time [ti, t(i+1)] in which the population size remains equal to Ni. It is further assumed that the population size was constant and equal to NJ before some time tJ in the past.

Migration
An option is proposed to account for recurrent immigration from a large population of constant structure. Two additional parameters are needed:
- the size of this external population;
- the rate of immigration, given as a constant number of immigrants per generation, or as a constant rate of immigration (in that case the mean number of immigrants is variable and proportional to the sizes Ni of the population in the past).
Software use
Restrictions on the Model
- No more than 50 time events tJ (Jmax <=50)
- No more than 10 steps for user-defined mutation model (K <= 10).
- No more than 1,000,000 generations between t0 and tJ.
Input of parameters
The user is asked a name for the output file (max: 20 characters), and values to fix the mutation model and the past demography of the population.
>Give the name of output file
>Enter mutation model
To use the Single Step Model you have to enter 1.
To use the Geometric model, you have to give the ratio c (0 < c < 1).
To use the Special Model you have to enter the number K of possible steps (1<K<=10) then, enter values of pairs (k, mk) (note: m1 + m2 + … + mK = 1).
If you need HELP, you have to enter a negative number
If you need to STOP, you have to enter 0
>Give the current effective size N_0 of the population
>Give the mutation rate µ
>Give the total number of events (J)
If you have one effective size and if you want this size to be constant you have to enter 0.
If you want to variable size so J>1, you have firstly to list the past effective sizes N1,N2,...,NJ and secondly you have to list the past times when size changed t1,t2,...,tJ.
>Choose Migration (1) or No migration (0)
[Optional, if the Migration Model is chosen]
Give the size of the large external population
Choose the model of migration
- Constant rate or Constant Number of immigrants
- and either the constant rate of the constant number of immigrants
Example
We consider a population of present effective size 1000 that underwent a bottleneck between the 100-th and 200-th generations before present time. The global mutation rate of 0.001.

See below the details with the Single Step Model (SSM). The same example with the two others models are presented with just the prompt different from the SSM.
Single Step Model
We are presenting here an example of a session of DemoDivMS in the case of SSM model
  Microsatellite allelic diversity after demographic changes
  Calculus of Pr( D = d / µ, N_0, N_1, ...),
the probability that 2 microsatellite alleles show a difference of  d  repeat motifs
  according to past demographic fluctuations
  Give name of output file (max 20 characters)
outfile
  Calculating the  Pr( D = d / µ, N_0, N_1, ...) ...
  Enter mutation model / Stop
                  STOP : answer 0
     Single Step Model : answer 1
     Geometric model   : give the ratio c (0 < c < 1)
     Special Model     : enter the number K of possible steps (K > 1)
                  HELP : enter a negative number
-1
  Stepwise Mutation Models
  Single Step (answer= 1), one motif is added or withdrawn
  Geometric model (answer a real number c, 0<c<1 )
        under mutation the number of added or withdrawn motifs
        is k with probability equal to  (1-c)*c^(k-1)
  Special model (answer an integer number K, 1 < K <= 10)
        under mutation the number of added or withdrawn motifs
        is k with probability  m_k.
        K pairs of values (k, m_k) must be given
  Enter mutation model / Stop
                  STOP : answer 0
     Single Step Model : answer 1
     Geometric model   : give the ratio c (0 < c < 1)
     Special Model     : enter the number K of possible steps (K > 1)
                  HELP : enter a negative number
1
  Give the current effective size N_0 of the population
1000
 Give the mutation rate µ
.001
  Modelling past variations of population size
size N
    !
N_J !                                ___________
    !                               !
N_2 !              ____  ....
    !            !
N_1 !       _____!
    !      !
    !      !
N_0 !______!
    !
    !
    !
    !____________________________________________
    t_0=0     t_1   t_2     ....      t_J     time in the past
 Give the total number of time events (Jmax)
 0 if the effective size has been constant
2
  Give the series of N_1, N_2, ... N_Jmax.
500 1000
 Give the series of times  t_1, t_2,...,t_Jmax.
100 200
Model with immigration ?
if immigration: answer 1, otherwise: 0
0
Geometric Model
We are presenting here an example of DemoDivMS entry in the case of geometric model
 Enter mutation model / Stop
STOP : answer 0
Single Step Model : answer 1
Geometric model   : give the ratio c (0 < c < 1)
Special Model     : enter the number K of possible steps (K > 1)
HELP : enter a negative number
.05
User defined model assuming either 1 or 2 steps
We are presenting here an example of DemoDivMS entry in the case of a user defined model
 Enter mutation model / Stop
STOP : answer 0
Single Step Model : answer 1
Geometric model   : give the ratio c (0 < c < 1)
Special Model     : enter the number K of possible steps (K > 1)
HELP : enter a negative number
2
For each case, give the number of steps and the probability
case   1: how many steps, which proba ??
1 .95
case   2: how many steps, which proba ??
2 .05
h4.Choosing a migration model
We are presenting here an example of DemoDivMS entry in the case immigration.
Model with immigration ?
if immigration: answer 1, otherwise: 0
1
Give the size of the large external population
5000
Give the immigration rate. Two options are proposed:
First option : constant rate
(the number of immigrants is proportional to the current population size)
Second option: constant number of immigrants
give the option (1 or 2), and the right number
2 1
Outfile
We present here an example of output file.
  Microsatellite allelic diversity  after demographic changes
Calculus of Pr( D = d / µ, N_0, N_1, ...),
the probability that 2 microsatellite alleles
show a difference of  d  repeat motifs
according to past demographic fluctuations
***************
Single Step Mutation model, µ = 0.00100
Current effective size   1000.
Number of past demographic events =  2
Series of past effective sizes
1000.    500.   1000.
Series of times when size changed
0.    100.    200.
No migration, the population is isolated
Largest value of D used =      13
Total probability of unconsidered events = 0.00008
Expected homozygosity Pr(D=0) = 0.35453
Probabilities Pr(D=1) to Pr(D=13)
0.16378 0.07966 0.03966 0.01982 0.00991 0.00495 0.00248 0.00124 0.00062 0.00031
0.00015 0.00008 0.00004
Mean and standard error of |D|:   1.27944   1.47130
Corresponding values of theta = 4Nµ under constant population size and SSM,
from homozygosity :   3.47797
from mean of |D|  :   3.71460
from mean of D^2  :   3.80168
***************
Single Step Mutation model, µ = 0.00100
Current effective size   1000.
Number of past demographic events =  2
Series of past effective sizes
1000.    500.   1000.
Series of times when size changed
0.    100.    200.
Assuming immigration from a large population in equilibrium, of constant size
Nefext =      5000 (theta =    20.00 )
Constant number of immigrants per generation =   1.000
Largest value of D used =      29
Total probability of unconsidered events = 0.00007
Expected homozygosity Pr(D=0) = 0.25224
Probabilities Pr(D=1) to Pr(D=29)
0.11867 0.07265 0.05015 0.03596 0.02610 0.01901 0.01387 0.01012 0.00739 0.00539
0.00393 0.00287 0.00210 0.00153 0.00112 0.00081 0.00059 0.00043 0.00032 0.00023
0.00017 0.00012 0.00009 0.00007 0.00005 0.00003 0.00003 0.00002 0.00001
Mean and standard error of |D|:   2.59948   3.06586
Corresponding values of theta = 4Nµ under constant population size and SSM,
from homozygosity :   7.35863
from mean of |D|  :  13.99735
from mean of D^2  :  16.15678Mathematical background
Mathematical background
Calculations are based on the joint analysis of the drift process in a finite population and of the mutation process at a microsatellite marker.
Drift in a population with variable size is studied assuming that the population has undergone successive periods in which population size remained constant, so that the global analysis of the coalescent is split into such periods. Hence calculations are easy within each period, and tractable when joining periods, to get in fine analytical expressions for most parameters of interest.
Modelling mutations assumes that under mutation of an allele, the number of the microsatellite motifs may be changed with probabilities that do not depend on the number of motifs in the allele. Although restrictive, the formulation allows analytical solutions to be derived using generating functions of the distributions, for any symmetrical mutation model. The single step mutation model, the geometric model and any user-defined stepwise mutation model are implemented in the program.
Basic calculations are concerned with the joint probabilities that a set of alleles are copies of a single ancestor gene some time ago, and that they show some difference concerning their state (number of microsatellite motifs). Results allow both the distribution of coalescent time and of distances between alleles to be calculated, for a large class of stepwise mutation models and for any ancestral demography. In the present program, only probabilities of distances between alleles are proposed, but the theory allows also the distributions of coalescent times to be calculated.
From a technical point of view, analytical solutions are obtained for the Fourier transform F(x) of the distribution of distances D between pairs of alleles (the distance between 2 alleles is the difference between the numbers of motifs they bear):
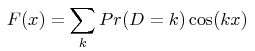
the summation being taken on all negative, null and positive integers k (noting that P(D=k) = P(D=-k) ). Analytical expressions of the function F(x) are shown in the given reference, as a function of the mutation model and of the demographic history assumed for the population. The numerical value of the probability that two alleles are at distance k is then obtained in this program from a numerical integration:

Additional indices of diversity are calculated from this distribution, such as the expectation and variance of the distances between alleles in a sample, and values of the theta = 4 N µ parameter giving the same diversity measures under basic assumptions of constant population size and single step mutation model.
References
Nikolic N, Butler J, Baglinière J-L, Laughton R, McMyn I.A.G, Chevalet C. 2009. An examination of genetic diversity and effective population size in Atlantic salmon. Genetics Research. 91: 1-18.
Chevalet C & Nikolic N. 2010. Distribution of coalescent times and distances between microsatellite alleles with changing effective population size. Theoretical Population Biology, 77(3): 152-163.